Slow access
Business users spent hours navigating complex Power BI dashboards to find the right numbers.
New: Chai, my AI assistant, can brief you on my work in 60 seconds.
Case study · PepsiCo · AI & Data
An AI chatbot that lets PepsiCo's commercial teams ask for sales data in plain language, instead of digging through dashboards or waiting on analysts.
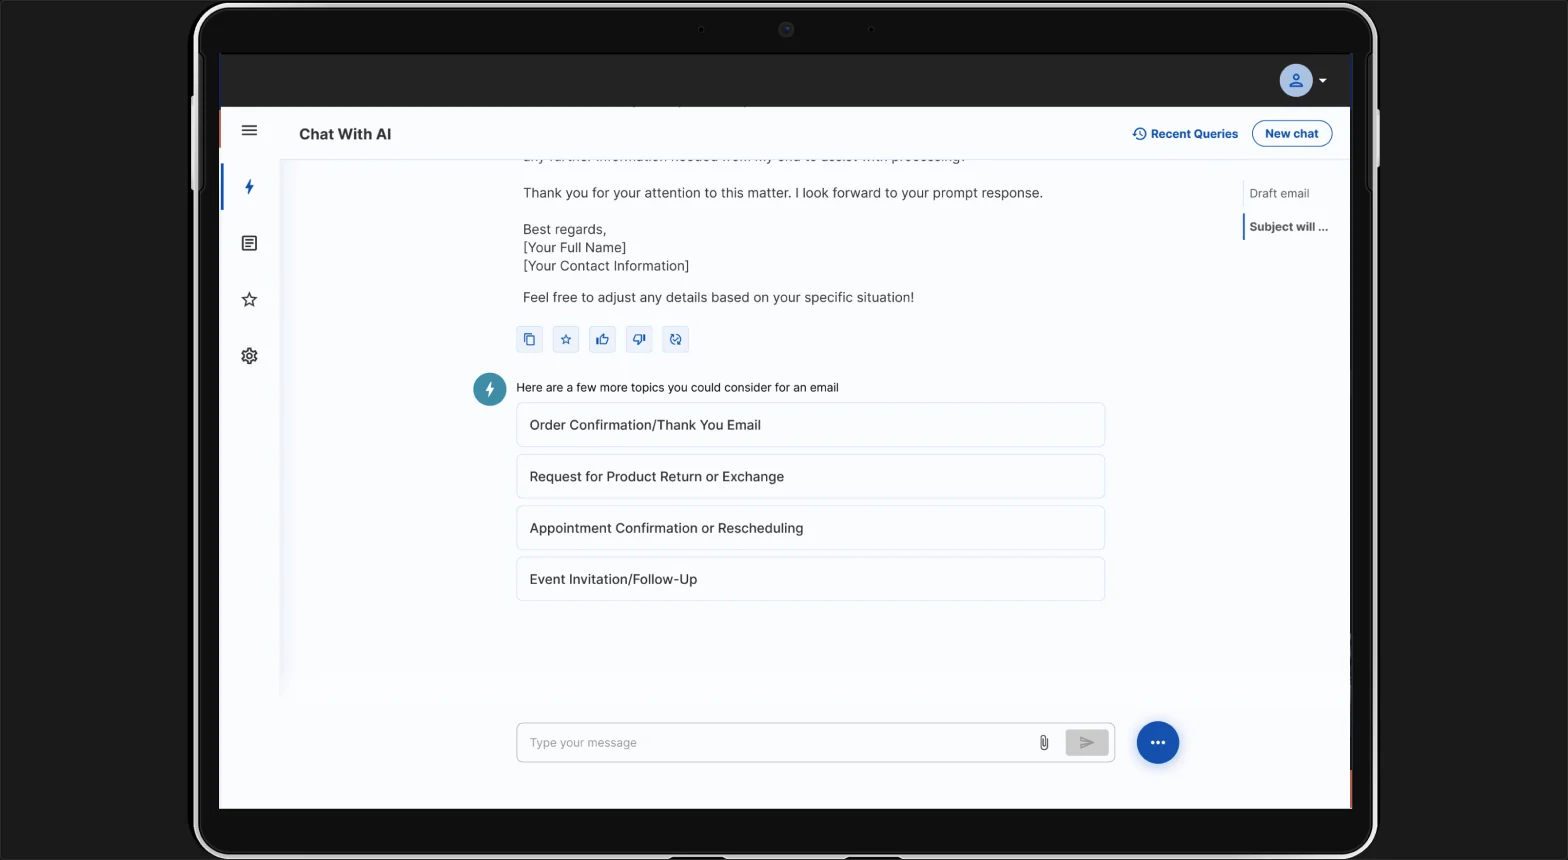
Some data in the screens is blurred or replaced to respect PepsiCo confidentiality.
The challenge
PepsiCo's commercial teams kept their sales data in Power BI dashboards and static reports. A basic question meant hours of navigation or a request to an analyst, and non-technical staff avoided the tools.
What I led
Worked with product managers, data analysts and developers.
The outcome
Impact
Routine sales questions now take one chat message instead of a dashboard search or a request to an analyst.
less time to retrieve data
of routine queries handled by the bot
user groups served from one interface
Analyst workload dropped as the bot took over routine queries, and non-technical users who had avoided data tools started using DWD.
Context
Dialog with Data (DWD) is an internal web app built for PepsiCo through Tech Mahindra. Sales executives, category managers, data analysts, marketing teams and Revenue Management all depend on the same commercial data: weekly sales, market share and growth comparisons. Until DWD, that data lived in Power BI dashboards and static reports.
DWD replaces that with a conversation. People ask for reports, summaries and insights without needing analytics skills, for example tracking dollar and volume trends for Frito-Lay’s Salty Snacks week by week.
The problem
Weekly sales numbers, market share shifts and growth comparisons sat inside Power BI dashboards and static reports. Answering a basic question meant hours of navigation or a request to an analyst.
Business users spent hours navigating complex Power BI dashboards to find the right numbers.
Reports were built by hand or on scheduled data pulls, which delayed decisions.
Many people needed an analyst to read the metrics, which slowed day-to-day work.
Non-technical stakeholders found the tools too complex, so usage was uneven across departments.
Business goalSpeed up decisions, reduce dependence on analysts, raise adoption of data tools and give every team consistent access to current commercial data.
My role
I was the design lead for DWD on the Tech Mahindra team working for PepsiCo. I owned the research plan, the conversation structure and the UI, ran the interviews and usability tests, and worked with product managers, data analysts and developers so the interface matched how the data actually worked.
Planned and ran stakeholder interviews with commercial leads, sales managers and analysts, plus workflow observation.
Turned research into personas, journey maps and the problem framing the team built against.
Defined the intent categories, data structure and the guided Q&A model the chatbot follows.
Designed wireframes and high-fidelity Figma prototypes in line with PepsiCo’s design system.
Worked with data analysts, product managers and developers to map backend data logic to the interface.
Ran usability tests and added in-product feedback so the team could keep iterating after launch.
Process
Interviews, observation, usage analysis
Personas, journeys, goals
Intents, IA, conversation model
Wireframes to hi-fi prototypes
Usability tests, in-product feedback
Retrieval time, query load, adoption
01 Discover
Discovery combined stakeholder interviews, workflow observation and analysis of how people used the existing data tools. The aim was to find the repeat questions, the workarounds, and where time was lost.
People told us the same three things: too many repetitive tasks, data in inconsistent formats, and no way to serve themselves.
Commercial leads, sales managers and data analysts.
How people moved between dashboards, reports and analysts.
Which queries came up most often, and how often.
Enterprise chatbot experiences, to set success metrics.
Key findings
Over 60% of queries were repetitive: weekly sales, market share shifts and growth comparisons.
People rarely needed a full dashboard. They wanted a quick answer in context that they could trust.
Data was pulled for presentations, updates and meetings, so people needed short summaries they could reuse.
Sales and marketing staff found the learning curve steep and wanted to ask the way they use search or a voice assistant.
Benchmark
I benchmarked enterprise chatbot experiences to set success metrics. Power BI Chat was the closest alternative the teams already had access to.
| Capability | DWD | Power BI Chat |
|---|---|---|
| Natural language queries | Contextual NLP | Basic NLP |
| Auto-generated summaries | Yes, shareable | Manual export |
| Live sales data | Integrated with IRI and internal dashboards | Manual or scheduled refresh |
| Easy for non-technical users | Conversational UI | Needs dashboard navigation |
| Analyst query load | 60%+ of queries automated | Limited impact |
| Fit to PepsiCo KPIs | Built around PepsiCo KPIs | Possible through the Power BI model |
| Scale across teams | Designed for enterprise-wide use | Scalable with setup |
02 Define · Users
Needs
Needs quick access to KPIs: weekly numbers, distribution changes, promotion results.
“Just tell me how last week went.”
Needs
Needs detailed, comparative views of brand and category performance, share trends and summaries.
“How did Salty Snacks do against a year ago?”
Needs
Wants to validate findings and dig into trends, and spend less time on repeat data pulls.
“I want to stop answering the same question.”
Also served: Marketing teams (campaign impact, volume trends and consumer behaviour data) and Revenue Management (pricing, volume and profitability, modelling performance across markets and checking trade spend efficiency). Category managers included trade managers, who needed competitive insights.
Persona quotes are illustrative summaries of interview themes, not verbatim.
Journey
I mapped journeys for the most common use cases, including the “Weekly Sales Check-in” and the “Market Share Summary”. The check-in shows the gap most clearly.
03 Structure
I mapped common intents, such as checking weekly sales or comparing brand performance, and grouped them into five categories. Each category breaks down into the same four data building blocks, so the bot can handle new questions without new screens.
Intent categories
Data building blocks
Conversation model
“Would you like sales for a specific product or total performance?”
Ask about “chips” and DWD applies the right product family filter.
“Sales for Lay’s increased by 8% vs. last week,” with options to expand, export or summarise.
Conversation flow
Every conversation was built to end in an action, not just a number.
Natural-language input or dropdown selections
Contextual prompts, such as “Would you like a summary report?”
An answer with buttons to expand, export or summarise
Under the hood this is a hybrid: a natural-language layer for flexibility, decision-tree logic for speed on known paths, and prompts that invite the next question. The structure was set up to take on new data sources, KPIs and business units later.
Key decisions
People were used to checking numbers with an analyst. Showing the query next to each response lets them see where an answer came from.
A blank chat box is hard for new users. Starter cards (Commercial, Consumer) and suggested follow-ups give a way in, while power users can type anything.
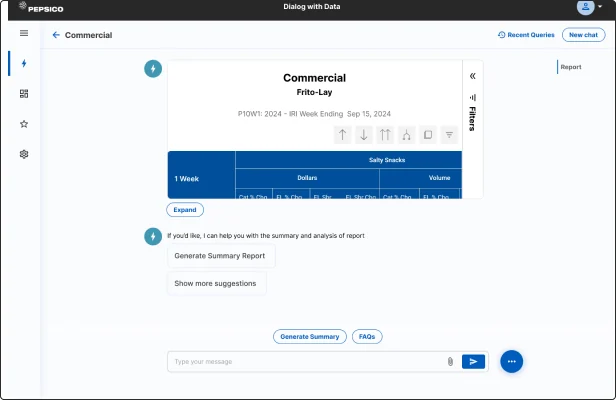
Research showed people wanted short answers they could share. DWD leads with a summary and lets users expand the full report card when they need detail.
Over 60% of questions were repeats, so Recent Queries and Quick Reports let people rerun a common question instead of typing it again.
Top products, sales volume, channel performance and display metrics are the comparisons people asked for most, so each has its own view.
04 Design
Wireframes focused on three parts: the chat layout with message input and AI prompts, the embedded report preview card (for example Frito-Lay Sales, 1 Week) and the action panel (Generate Summary Report, Expand). High-fidelity prototypes were built in Figma.
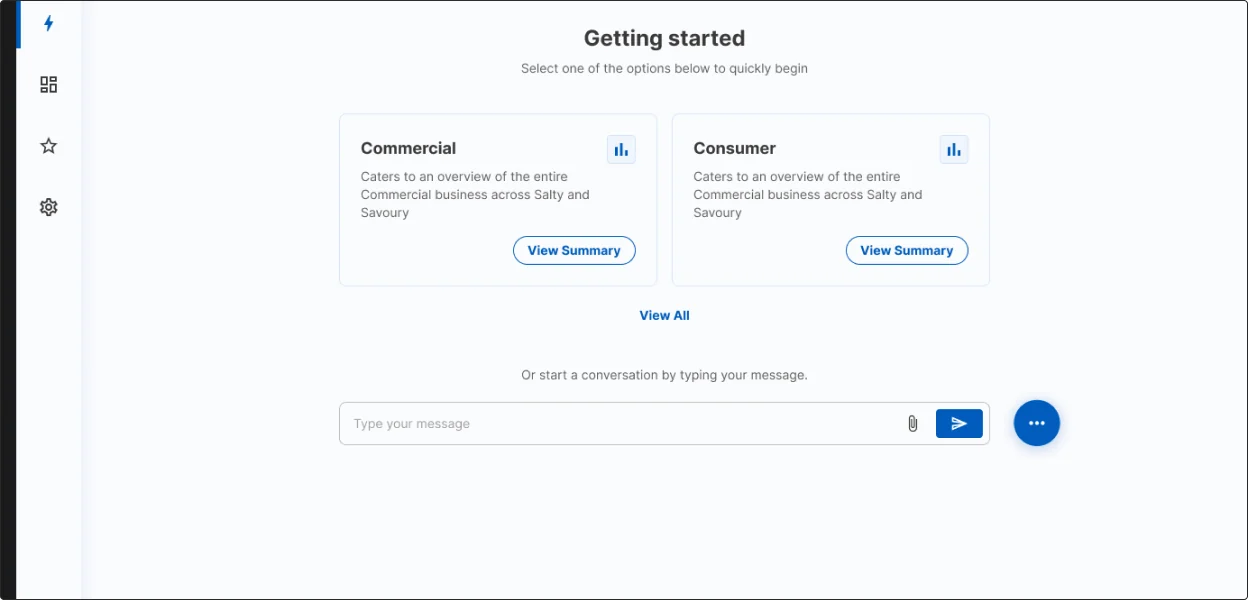
Starter cards give new users a way in; anyone can still type a question.
A weekly Salty Snacks report returned in the conversation. DWD leads with a summary and lets users expand the full report card when they need detail.
Suggested follow-ups give a way in, while power users can type anything. Each response can be copied, saved, rated or regenerated, and the same chat also helps with everyday tasks such as drafting an email.
Engagement
Research and behaviour data shaped seven features meant to bring people back.
Suggests next steps from past use. Someone who often checks Salty Snacks sales is offered “Would you like to see last week’s update again?”
A conversational summary of key changes at the start of each week. It became a popular way back into the product.
Shows what colleagues are asking, which helps with the blank-page problem.
A light tutorial for new users. After a report, DWD might ask “Did you know you can also compare this to the previous 4 weeks?”
Remembers preferred categories, timeframes and metrics.
Thumbs up or down and “Was this helpful?” on every report.
A context-aware FAQ and quick tips inside the chat.
05 Validate
I ran usability tests on the prototype to check the conversation flow and the report cards. After launch, the thumbs up and down buttons on each report gave the team a steady signal on which answers were useful, so we could iterate quickly.
06 Outcomes
reduction in data retrieval time
of routine queries automated
Analyst workload dropped as the bot handled most routine queries, freeing analysts for deeper analysis and modelling.
Adoption grew among non-technical users who had avoided data tools before.
Teams made decisions faster and from the same, current commercial data.
Learnings
With AI answers, people want to see where a number came from before they act on it. That is why every DWD answer shows its SQL.
Repeat questions, over 60% of all queries, set the priorities: recent queries, quick reports and the weekly digest.
Intent categories and shared data blocks meant new questions and KPIs fit without new screens.
Next: the architecture was set up to add new data sources and more advanced analytics without changing the conversation model.